The chart below shows a simple portfolio containing four famously stable shares in Disney, Starbucks, McDonalds and Coca-Cola. Using data from the previous year, and assigning equal weights to each asset, gives the portfolio represented by the blue dot. This gave an expected annualised return of around 8%, whereas an optimised portfolio of the same assets (the pink dot) gave an expected annualised return of around 25% at the exact same level of risk.
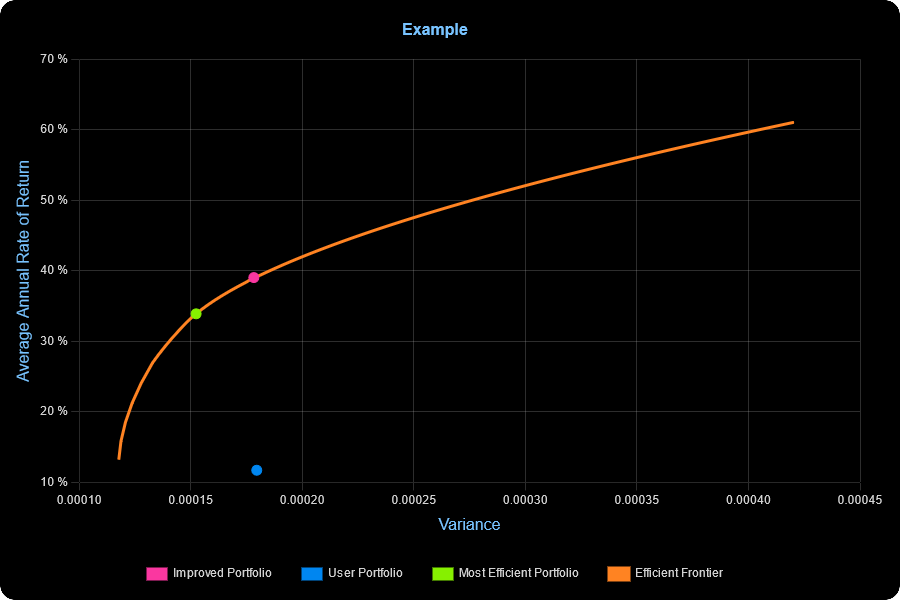
All smart investors consider the risk and return of their assets, but what most investors don’t see is how these investments combine to give their risk and return at the portfolio level – and the results can be surprising.
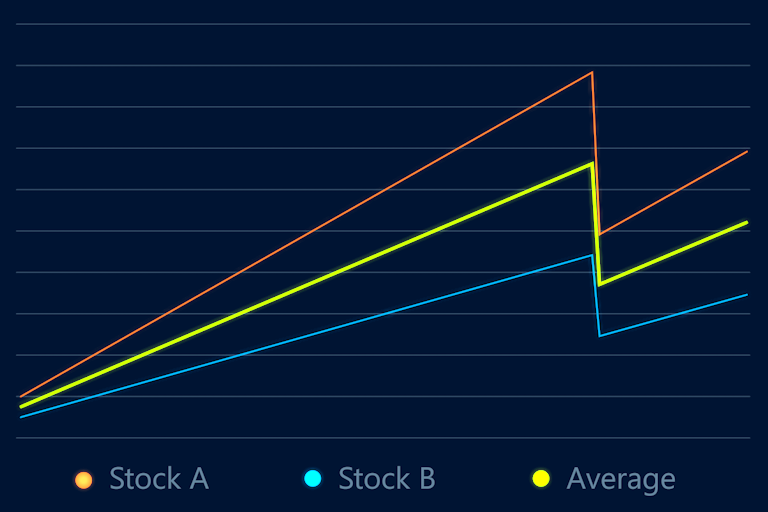
Two safe assets may have the same vulnerabilities to market movements or shocks – which could mean holding both actually makes a portfolio riskier. Similarly, two high-risk, high-return assets might offset each other to produce an underwhelming result.
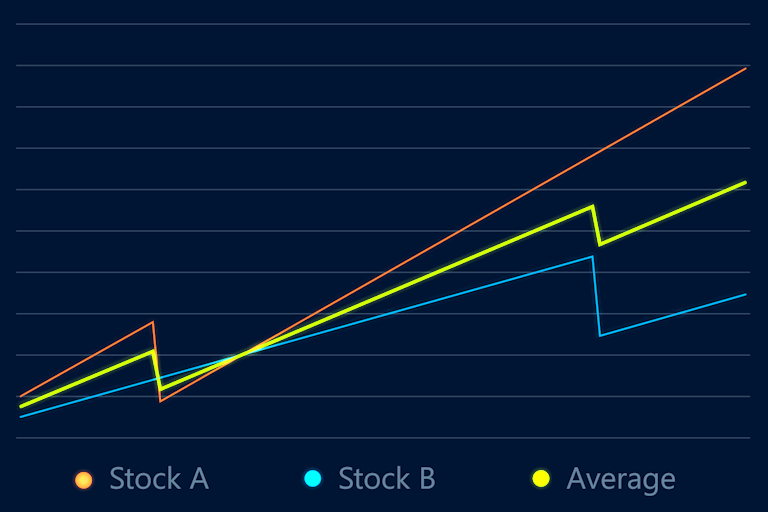
A diversified portfolio means investors are less exposed to shocks.
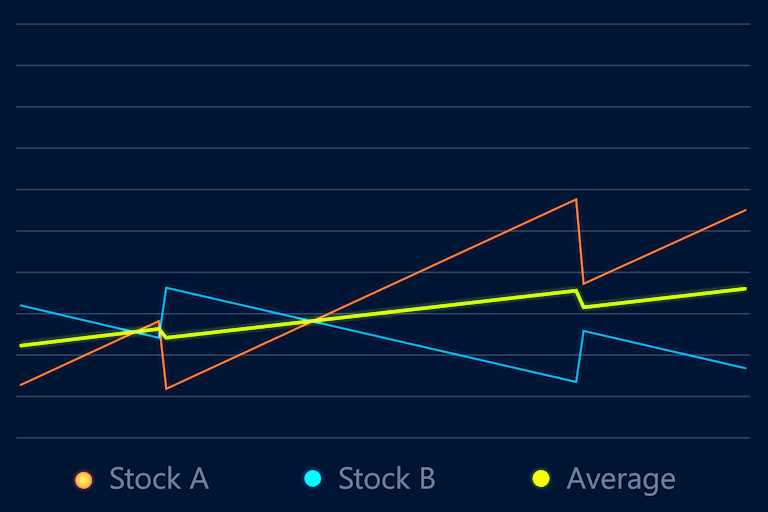
Two high-risk, high-return assets might move against each other to produce an underwhelming result.
By analysing the combined variance, covariance and return for all assets in a portfolio, our API gives your customers the weights they need to assign their assets to have the best chance of reaching their goals – whether that’s the minimum combined variance, maximum return, or anything in between.
Working out these answers can take a lot of computational power – so for bigger portfolios it can take up to 225 million operations across 750,000 data points just to set up the question.
After that, finding the answer is an intelligent, iterative process that may perform as many as a trillion calculations.
This calculation is carried out to order for each unique portfolio – in almost all cases results are available in a few seconds, and even the biggest enquiries will never take more than about 15 minutes.